
Technology & Software
Macktez Monitor: Building on Our AI Foundations
How we turned the connections behind our AI tools into a monitoring platform — and brought its history and insights back to those tools.
At a Glance
- Client
- Macktez (internal)
- Problem
- No single dashboard showed everything we wanted to know. Vendor consoles each exposed part of the picture, with limited history. Understanding a client’s environment meant gathering information from several systems by hand.
- Approach
- Reuse our existing MCP connections to collect data on a recurring schedule, retain its history, and combine it into a more complete picture.
- Outcome
- A growing monitoring platform that gives our team and AI tools shared access to system health, historical context, and insights that individual platforms cannot provide on their own.
The Idea
Existing infrastructure, new capabilities
We built our custom Model Context Protocol (MCP) connections so our team could use AI tools to work across the platforms we manage. That shared foundation subsequently enabled support.agent, our autonomous digital employee.
It also created an opportunity. The connections could serve ordinary software as readily as a language model. We could use them to gather information continuously, without building another set of vendor integrations.
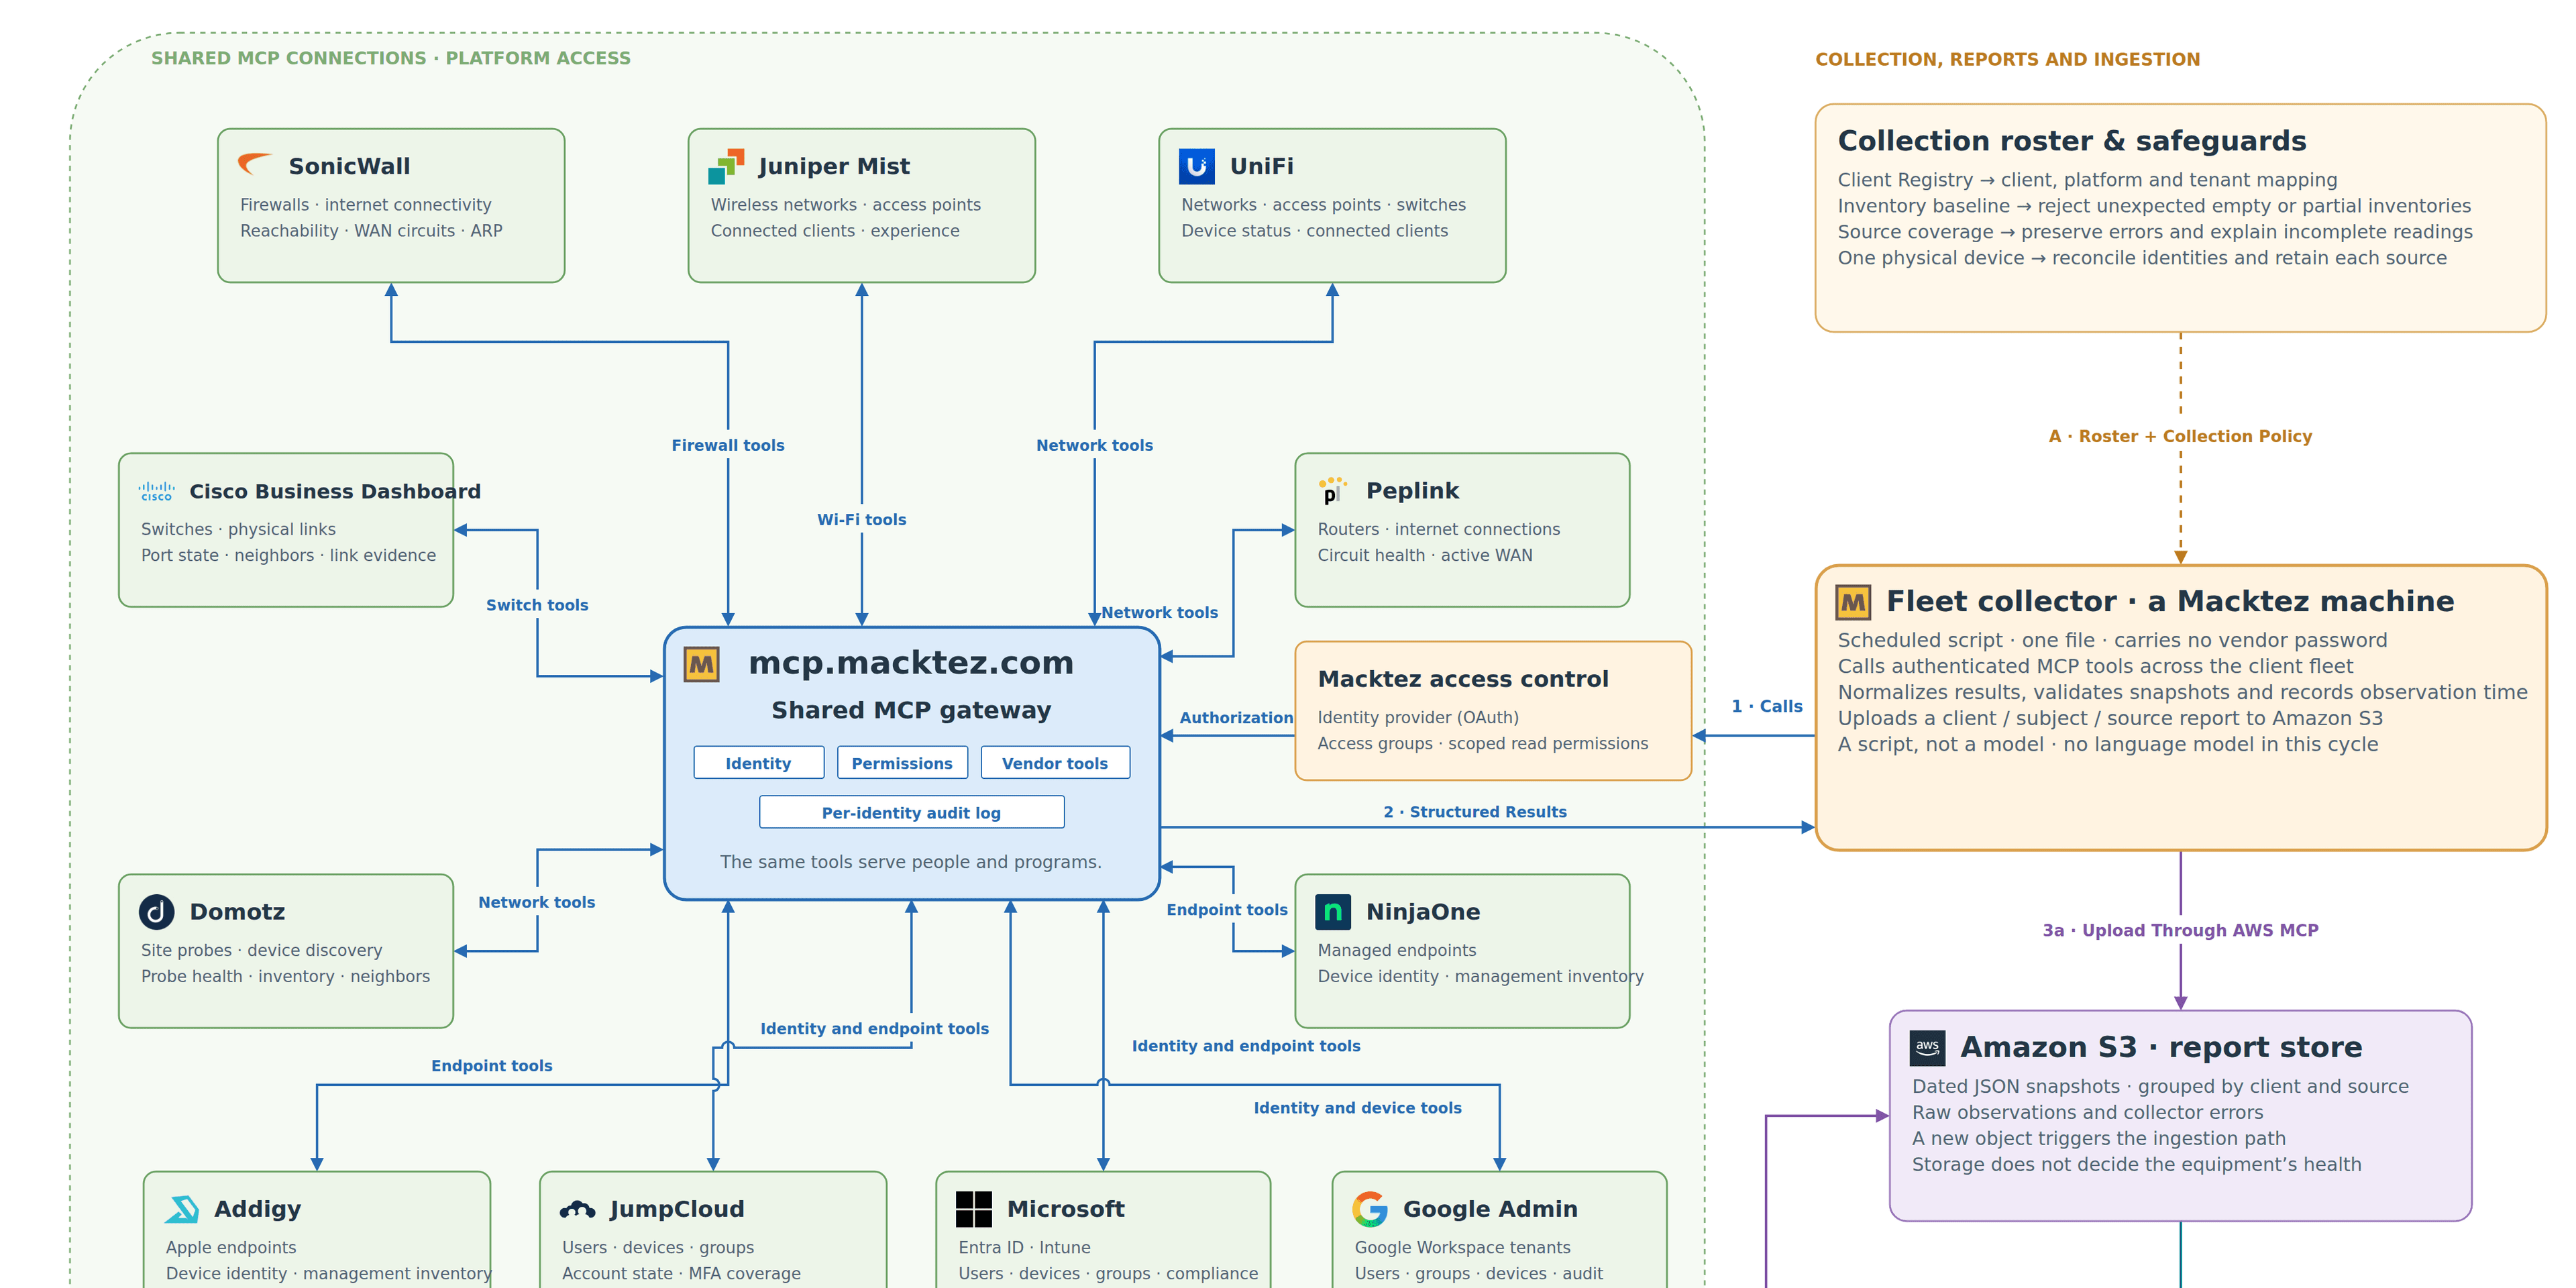
Using AI-assisted development, we built Macktez Monitor around that idea. A scheduled script queries our vendor platforms through MCP, while collectors inside client networks gather readings from local systems. Reports arrive in a central storage repository on AWS S3, where they trigger processing by the Monitor application.
Deterministic rules interpret the readings and store the results. No LLM is involved in collection or health assessment.
What It Adds
A more complete view across systems and time
Bringing the data together makes new capabilities possible.
A live network topology map, for example, draws on information from firewalls, switches, access points, and device management platforms. Assembling that view previously required logging into several systems and reconciling their answers. Monitor now renders it automatically, showing connections across equipment from different vendors and making gaps in the available information visible.
History adds another dimension. We can see when a device disappeared, whether a condition is recurring, or how long it has been since a backup completed successfully. A successful reading also has an age: when fresh information stops arriving, Monitor shows that uncertainty instead of leaving yesterday’s reassurance on screen.
Together, those capabilities give our team a stronger starting point for troubleshooting and planning.
Closing the Loop
Better information feeds back into our AI tools
Monitor exposes its accumulated history and insights through its own MCP tools. Our team, support.agent, and our investigation workflows can use that context alongside live vendor readings.
An investigation can begin with what changed, what has persisted, and what else was happening at the site, then query individual systems for more detail.
That closes the loop: infrastructure built for AI enables a new operational tool, and that tool gives AI-assisted work better information.
Built to Last
Built to improve and expand
Ongoing performance work keeps Monitor lean as its coverage grows. We measure changes, reduce unnecessary processing and database writes, and refine how much detail we retain over time.
That discipline keeps operating costs low and creates room for more systems and more frequent readings. Each addition to our shared connectivity becomes another opportunity to extend the platform.
AI-assisted coding helps us act on those opportunities: developing features, improving existing workflows, and testing whether an idea delivers enough practical value to keep.
For Clients
Find new solutions to familiar challenges
Monitor began with a familiar frustration and infrastructure we already had. Recognizing how those pieces could work together created something more useful than either alone.
We help clients find similar opportunities in their own businesses: understanding where work gets stuck, identifying where AI and custom software can help, and building solutions that fit the way their teams operate.
Start With What You Have
Ready to explore what we could build together?
Tell us where the work gets stuck. We’ll help you see where AI and custom software fit the way your team already operates.
Let’s TalkRelated
For the connections underneath it and the network work it watches, see:
For the fundamentals behind what it measures and how its access is scoped, see our University guides:
For the rest of what we built on these connections, and how we build, see these case studies: